
Pool Industry Statistics 2026: Market Size, Growth Rate, and Business Count


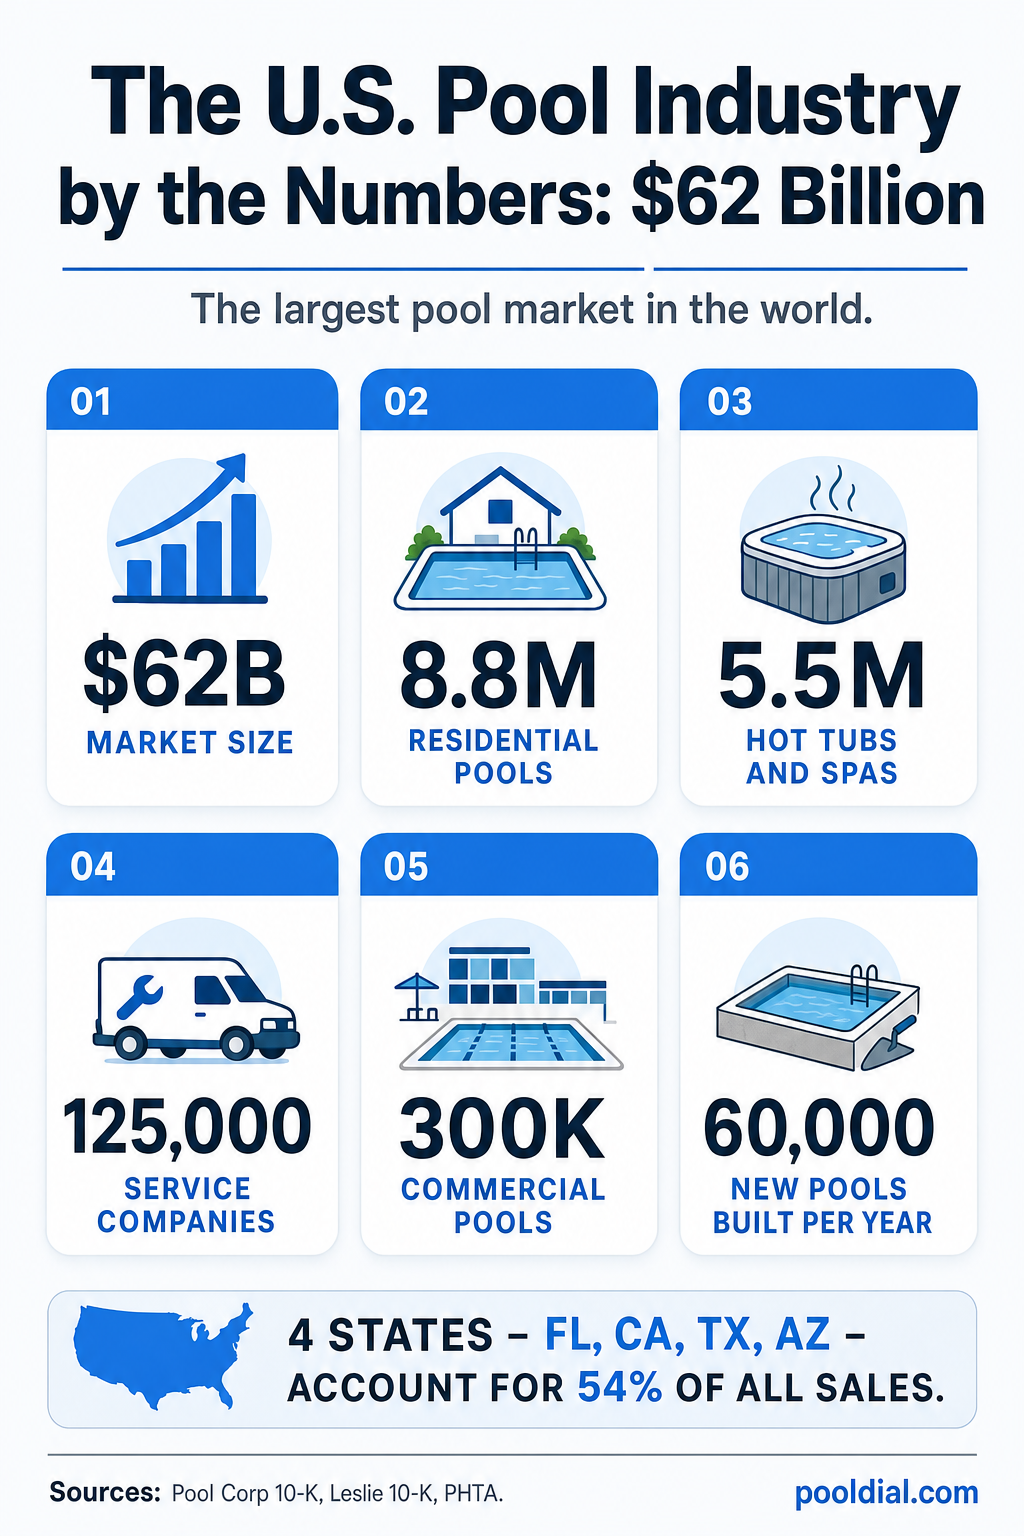
The U.S. pool, hot tub, and spa industry is a $62 billion market[1]Pool & Hot Tub AlliancePHTA Industry Fact Sheet, 2025phta.org serving over 14 million pools and spas.[2]Leslie's Q4 2024 Earnings CallNovember 2024insidermonkey.com Despite a 50% decline in new pool construction since the pandemic peak, the industry has proven remarkably resilient—anchored by the non-discretionary maintenance spending that keeps existing pools running.
This article compiles the most current, verifiable statistics on pool industry market size, growth rates, and business counts from SEC filings, earnings calls, and trade association data.
Key Statistics at a Glance
- $62 billion — Total U.S. pool, hot tub, and spa industry value [1]Pool & Hot Tub AlliancePHTA Industry Fact Sheet, 2025phta.org
- $15 billion — Annual pool and spa care aftermarket [3]Leslie's, Inc.Annual Report (Form 10-K), FY 2024SEC EDGAR
- 14+ million — Total pools, spas, and hot tubs in the U.S. [2]Leslie's, Inc.Q4 2024 Earnings Call, November 2024Insider Monkey
- 125,000 — Pool service and retail businesses [6]Pool CorporationAnnual Report (Form 10-K), FY 2024SEC EDGAR
- 60,000 — New in-ground pools built annually (2025) [4]Pool CorporationQ4 2025 Earnings Call, February 2026Motley Fool
- 1–2% — Annual installed base growth rate [2]Leslie's, Inc.Q4 2024 Earnings Call, November 2024Insider Monkey
Total Market Size
The Pool & Hot Tub Alliance (PHTA) values the total U.S. pool, hot tub, and spa industry at $62 billion.[1]Pool & Hot Tub AlliancePHTA Industry Fact Sheet, 2025phta.org This encompasses:
- New pool and spa construction
- Renovation and remodeling
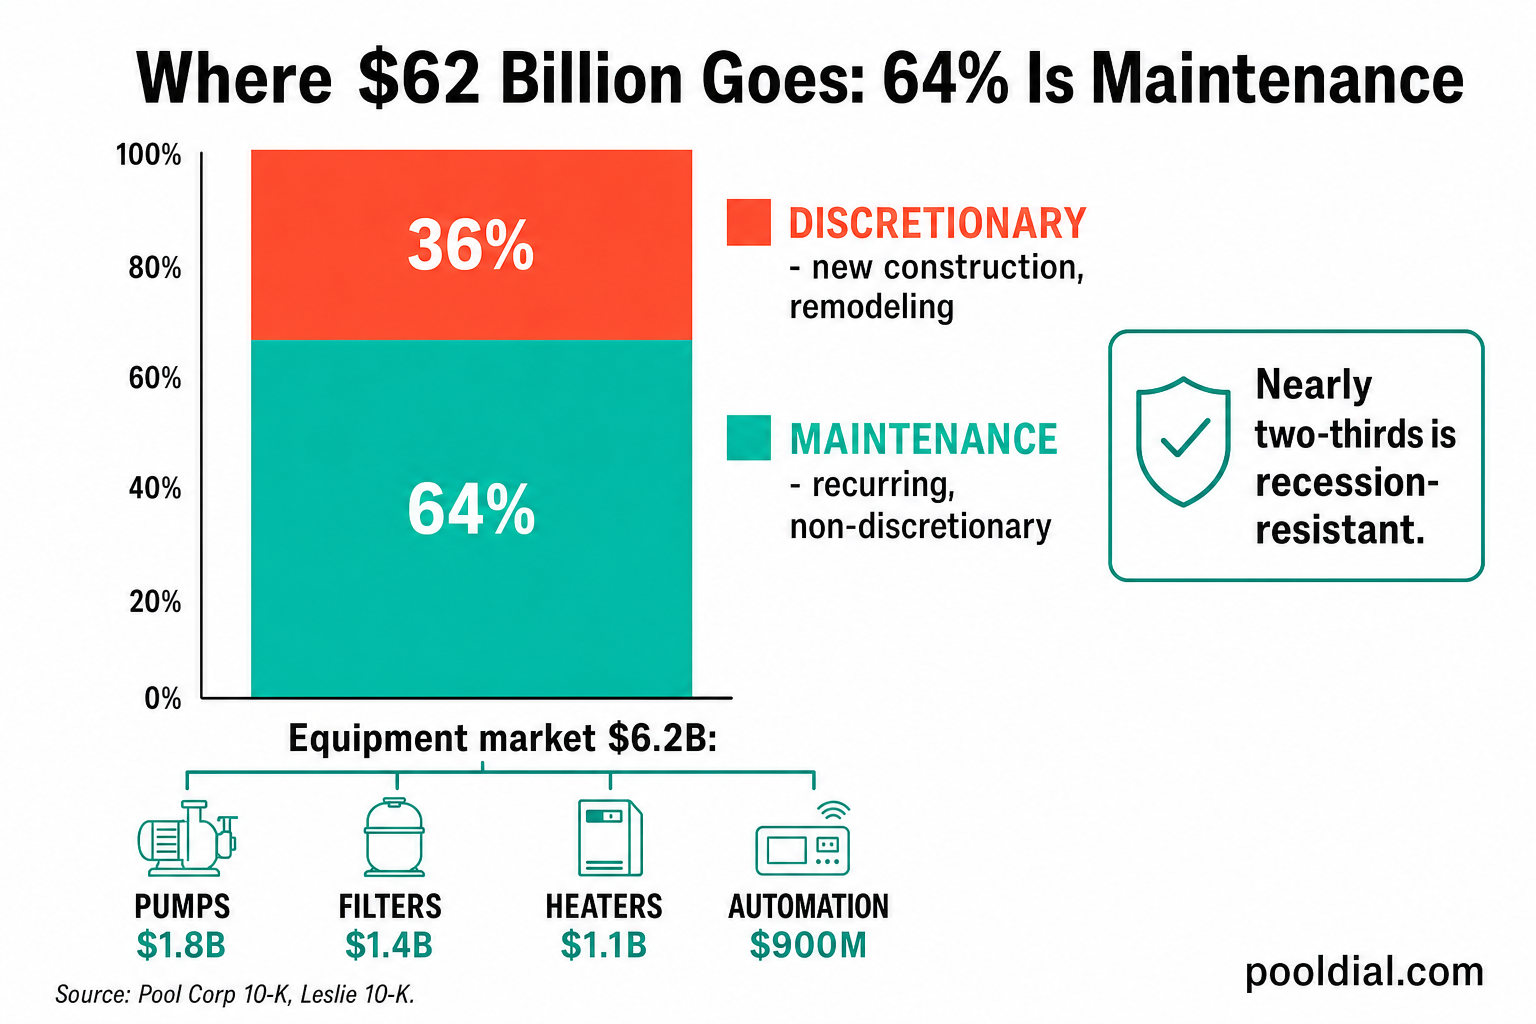
- Equipment manufacturing (pumps, filters, heaters, automation)
- Chemicals and maintenance products
- Professional service and repair
- Retail sales
The care and maintenance segment—what Leslie's calls the "aftermarket"—represents approximately $15 billion annually.[3]Leslie's 10-KSEC Filing, Fiscal Year 2024sec.gov This is the recurring revenue base that sustains the industry through construction downturns.
Market Segmentation
Pool Corporation, the industry's largest wholesale distributor, breaks down its $5.3 billion in annual sales by product category:[4]Pool Corp Q4 2025 Earnings CallFebruary 2026fool.com

The dominance of maintenance spending (64%) explains why the industry remains stable even as new construction declines. Pools that exist must be maintained regardless of interest rates or housing market conditions.
Number of Pools in the United States
The U.S. has approximately 14 million bodies of water requiring maintenance, including pools, spas, and hot tubs.[2]Leslie's Q4 2024 Earnings CallNovember 2024insidermonkey.com
| Category | Count | Source |
|---|---|---|
| Residential Pools | ~8.8 million | Leslie's 10-K (2024) |
| In-ground Pools | ~5.4 million | Pool Corp 10-K (2024) |
| Residential Spas/Hot Tubs | ~5.5 million | Leslie's 10-K (2024) |
| Commercial Pools | ~300,000 | Leslie's 10-K (2024) |
The installed base grows by 1% to 2% annually[2]Leslie's Q4 2024 Earnings CallNovember 2024insidermonkey.com—a compound effect that continuously expands the addressable market for maintenance services. Even with reduced new construction, the total pool count increases every year.
New Pool Construction Trends
New in-ground pool construction has declined sharply from pandemic highs:
| Year | New In-ground Pools | Change | Source |
|---|---|---|---|
| 2021 (Peak) | ~120,000 | — | Pool Corp 10-K (2021) |
| 2024 | ~61,000 | -49% | Pool Corp 10-K (2024) |
| 2025 (Est.) | ~60,000 | -50% | Pool Corp Q4 2025 |
Pool Corp estimates new pool construction at just under 60,000 units in 2025[4]Pool Corp Q4 2025 Earnings CallFebruary 2026fool.com—a 50% decline from the pandemic peak. High interest rates and elevated construction costs have cooled demand for new pools.

Despite this, the "Sand States" (Florida, California, Texas, Arizona) continue to dominate, accounting for approximately two-thirds (66%) of all new pool starts.[5]Latham Group 10-KSEC Filing, Fiscal Year 2024sec.gov

Number of Pool Service Businesses
The pool service industry is highly fragmented, with approximately 125,000 professional customers served by Pool Corporation's wholesale network.[6]Pool Corp 10-KSEC Filing, Fiscal Year 2024sec.gov The majority are small, family-owned independent contractors.
| Business Type | Count | Source |
|---|---|---|
| Pool Service/Retail Businesses | ~125,000 | Pool Corp 10-K (2024) |
| Independent Pool Retailers | 8,000+ | Leslie's 10-K (2024) |
| PHTA Member Organizations | 4,000 | PHTA (2025) |
Typical pool service businesses have no more than 10 employees; many are "one-man-and-a-truck" operations.[6]Pool Corp 10-KSEC Filing, Fiscal Year 2024sec.gov Even Leslie's, the largest national retail chain with 1,021 stores[3]Leslie's 10-KSEC Filing, Fiscal Year 2024sec.gov, holds less than 10% of the specialized care aftermarket.[3]Leslie's 10-KSEC Filing, Fiscal Year 2024sec.gov

2026 Market Outlook
Industry leaders project modest growth for 2026:
- Wholesale distribution: Low single-digit net sales growth expected[4]Pool Corp Q4 2025 Earnings CallFebruary 2026fool.com
- Equipment manufacturing: 3–4% sales growth projected[7]Pentair Q4 2025 Earnings CallFebruary 2026insidermonkey.com
- Industry sentiment: 69% of companies anticipate revenue growth over the next 12 months[8]PHTA Q3 2025 Pulse SurveyPool and Spa News, December 2025poolspanews.com
The service sector specifically is the industry's bright spot. According to PHTA survey data, service and maintenance companies were the only segment to report increased bottom-line profits in Q3 2025.[8]PHTA Q3 2025 Pulse SurveyPool and Spa News, December 2025poolspanews.com
Why the Industry Is Recession-Resistant
Pool industry fundamentals create a natural buffer against economic volatility:
- Non-discretionary maintenance: 64% of industry sales come from maintenance products that pool owners must purchase regardless of economic conditions[4]Pool Corp Q4 2025 Earnings CallFebruary 2026fool.com
- Growing installed base: Every new pool becomes a permanent maintenance customer, adding 1–2% to the serviceable market annually[2]Leslie's Q4 2024 Earnings CallNovember 2024insidermonkey.com
- Equipment replacement cycles: Pool equipment requires replacement every 8–11 years, creating predictable upgrade demand[9]Hayward Holdings 10-KSEC Filing, Fiscal Year 2024sec.gov
- Sunbelt demographics: Population migration to pool-heavy states (FL, TX, AZ) continues to drive regional demand[6]Pool Corp 10-KSEC Filing, Fiscal Year 2024sec.gov
As Pool Corporation CEO Peter Arvan noted: "Each year, new pools go into the ground creating growing demand for the products we sell to maintain and improve those pools every day."[10]Pool Corp Q4 2024 Earnings CallFebruary 2025insidermonkey.com
Key Takeaway
The pool industry's $62 billion scale masks its true stability: a $15 billion care aftermarket that generates recurring revenue regardless of construction cycles. With 14 million pools requiring year-round maintenance and 125,000 mostly small businesses serving them, the industry represents a massive, fragmented market with consistent demand.
For pool service professionals, the data is clear: the maintenance base is growing, the competition is fragmented, and the opportunity is durable.
Sources
- [1] Pool & Hot Tub Alliance (PHTA), "Industry Revenue Holds Steady Despite Profit Margin Pressure," 2025. phta.org
- [2] Leslie's, Inc. Q4 2024 Earnings Call Transcript, November 2024. Insider Monkey
- [3] Leslie's, Inc. Annual Report (Form 10-K), Fiscal Year Ended September 28, 2024. SEC EDGAR
- [4] Pool Corporation Q4 2025 Earnings Call Transcript, February 2026. Motley Fool
- [5] Latham Group, Inc. Annual Report (Form 10-K), Fiscal Year Ended December 31, 2024. SEC EDGAR
- [6] Pool Corporation Annual Report (Form 10-K), Fiscal Year Ended December 31, 2024. SEC EDGAR
- [7] Pentair plc Q4 2025 Earnings Call Transcript, February 2026. Insider Monkey
- [8] Pool & Hot Tub Alliance Q3 2025 Quarterly Pulse Survey, reported by Pool and Spa News, December 2025. Pool & Spa News
- [9] Hayward Holdings, Inc. Annual Report (Form 10-K), Fiscal Year Ended December 31, 2024. SEC EDGAR
- [10] Pool Corporation Q4 2024 Earnings Call Transcript, February 2025. Insider Monkey