
Sunbelt Migration Is Creating a Pool Service Boom: 2026 Data

The pool service industry is intensely regionalized. Just four Sunbelt states—Florida, California, Texas, and Arizona—generate 54% of all national pool industry revenue and account for two-thirds of all new pool construction. For pool service entrepreneurs, this geographic concentration represents both massive opportunity and fierce competition.
Key Statistics
The Revenue Concentration
Pool Corporation, the industry's largest wholesale distributor, reports that just four states—Florida, California, Texas, and Arizona—account for 54% of all net sales.[1]Pool Corporation 10-KFiscal year ended December 31, 2024SEC Filing
This means the remaining 46 states contribute an average of only 1% each to national wholesale trade activity. The industry's economic gravity sits firmly in the Sunbelt.

Distribution Center Footprint
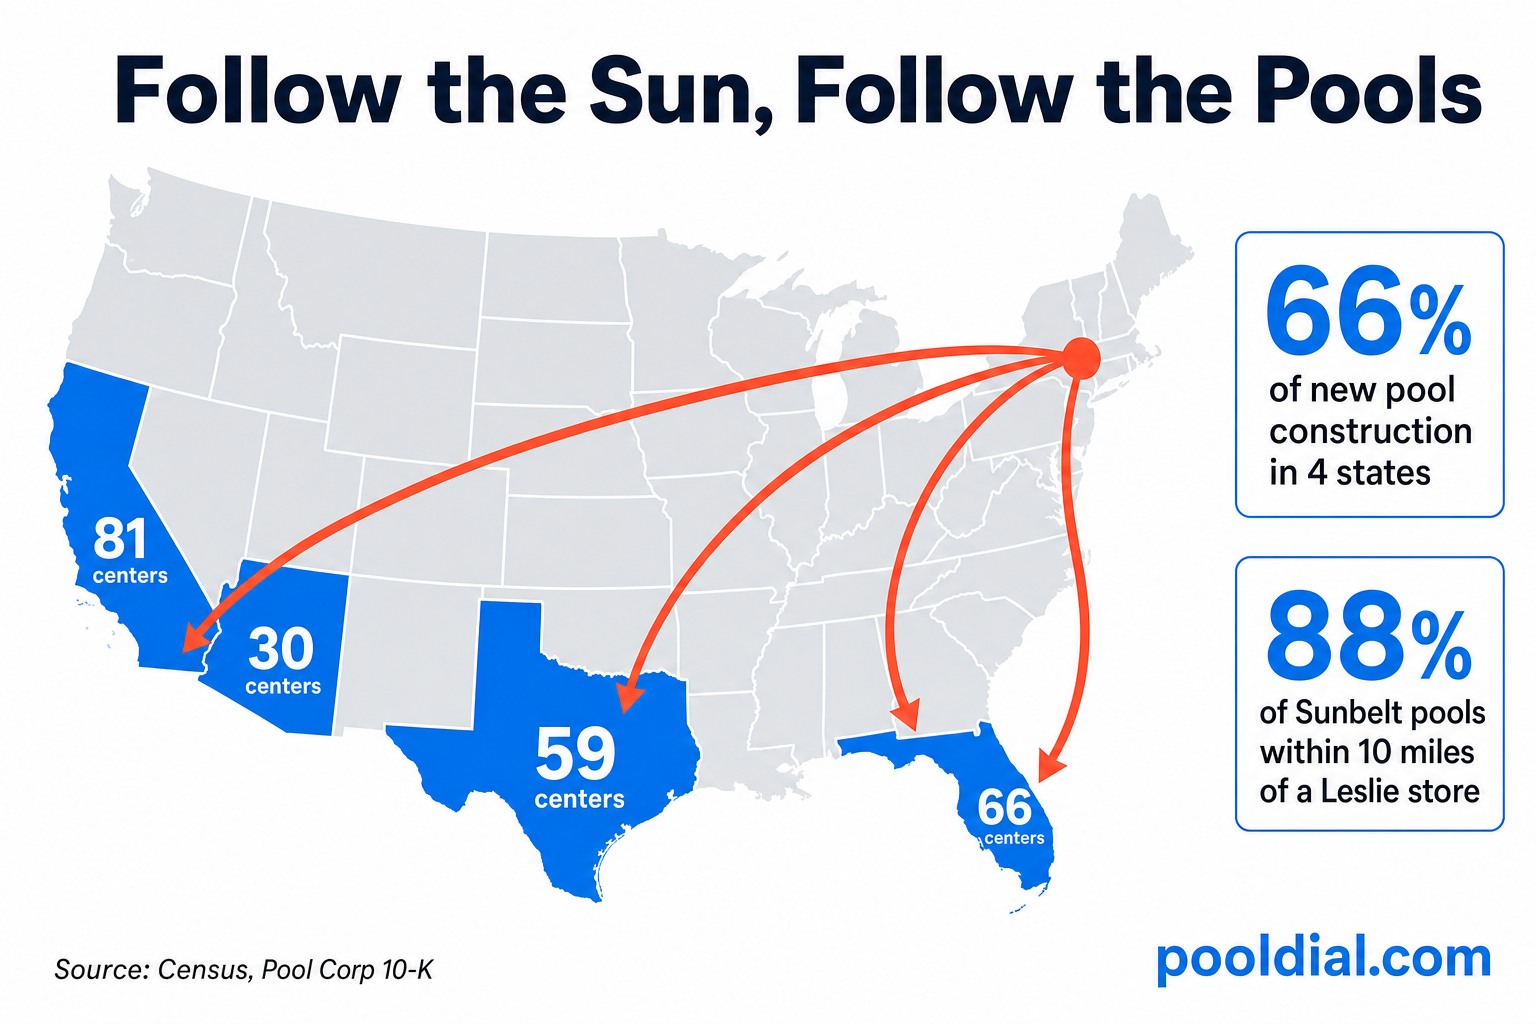
The concentration of pool service activity is reflected in where wholesale infrastructure is located. Pool Corporation operates 456 domestic sales centers, with the majority concentrated in four states:[1]Pool Corporation 10-KFiscal year ended December 31, 2024SEC Filing

These 236 sales centers in just 4 states represent approximately 59% of Pool Corp's entire national distribution infrastructure—located in just 8% of U.S. states.
New Construction Dominance
The Sunbelt's dominance extends beyond existing pools to new construction. According to Latham Group, the "Sand States" account for approximately two-thirds (66%) of all new U.S. pool starts.[2]Latham Group 10-KFiscal year ended December 31, 2024SEC Filing
This construction concentration has major implications for the future: because two-thirds of all new pools are built in just 4 states, these regions will capture 66% of the next decade's recurring aftermarket care growth as those pools age into maintenance cycles.

Florida: The Emerging Leader
While California currently has the most distribution centers, Florida is expected to soon become the largest U.S. market by total installed pool base.[4]Pool Corp Q4 2025 Earnings CallFebruary 2026Transcript
This shift is driven by sustained population migration to the Southern United States, a trend that Pool Corporation identifies as a key driver of long-term industry growth.[1]Pool Corporation 10-KFiscal year ended December 31, 2024SEC Filing
Key Insight
Pool industry activity is intensely regionalized: just four states (FL, CA, TX, AZ) generate over half of all national revenue and host two-thirds of all new construction. Florida is positioned to overtake California as the largest market by installed base.
Retail Coverage Density
The retail infrastructure in Sunbelt states is equally concentrated. Leslie's reports that almost 88% of pools in the Sunbelt are within 10 miles of a Leslie's store location.[3]Leslie's Q4 2024 Earnings CallNovember 2024Transcript
This density reflects both market size and competitive intensity—pool service businesses in these regions face sophisticated retail competition but also benefit from established supply chains and customer awareness.
What This Means for Pool Service Businesses
The geographic concentration creates distinct strategic considerations:
Operating in Sunbelt States
- Larger addressable market: More pools per capita means more potential customers
- Year-round demand: Warmer climates mean less seasonal fluctuation
- More competition: Higher density of service providers and retail options
- Established supply chains: Easy access to wholesale distribution centers
Operating Outside the Sunbelt
- Less competition: Fewer service providers per pool
- Seasonal business: Revenue concentrated in summer months
- Supply chain gaps: May need to travel further for wholesale supplies
- Higher prices: Less competition often supports premium pricing
For more regional analysis, see our guides on pool ownership rates by state and 2026 pool industry statistics.
| Metric | Sunbelt (4 States) | Rest of U.S. (46 States) |
|---|---|---|
| Revenue Share | 54% | 46% (avg 1% each) |
| New Construction | 66% | 34% |
| Distribution Infrastructure | 59% | 41% |
Sources: Pool Corp 10-K, Latham Group 10-K
Sources
- [1] Pool Corporation Annual Report (Form 10-K) — Fiscal year ended December 31, 2024. SEC Filing
- [2] Latham Group, Inc. Annual Report (Form 10-K) — Fiscal year ended December 31, 2024. SEC Filing
- [3] Leslie's, Inc. Q4 2024 Earnings Call — November 2024. Transcript
- [4] Pool Corporation Q4 2025 Earnings Call — February 2026. Transcript