
Pool Equipment Market Statistics 2026: Pumps, Heaters, and Automation

The U.S. pool equipment market represents approximately $6.2 billion in annual sales, with variable speed pumps, heaters, and automation systems driving growth even as new pool construction has declined.[1]Pentair PLC 10-KFiscal year ended December 31, 2024SEC Filing
This data comes from SEC filings of the three major pool equipment manufacturers--Pentair, Hayward, and Fluidra--as well as Pool Corporation, the largest equipment distributor.
Key Statistics
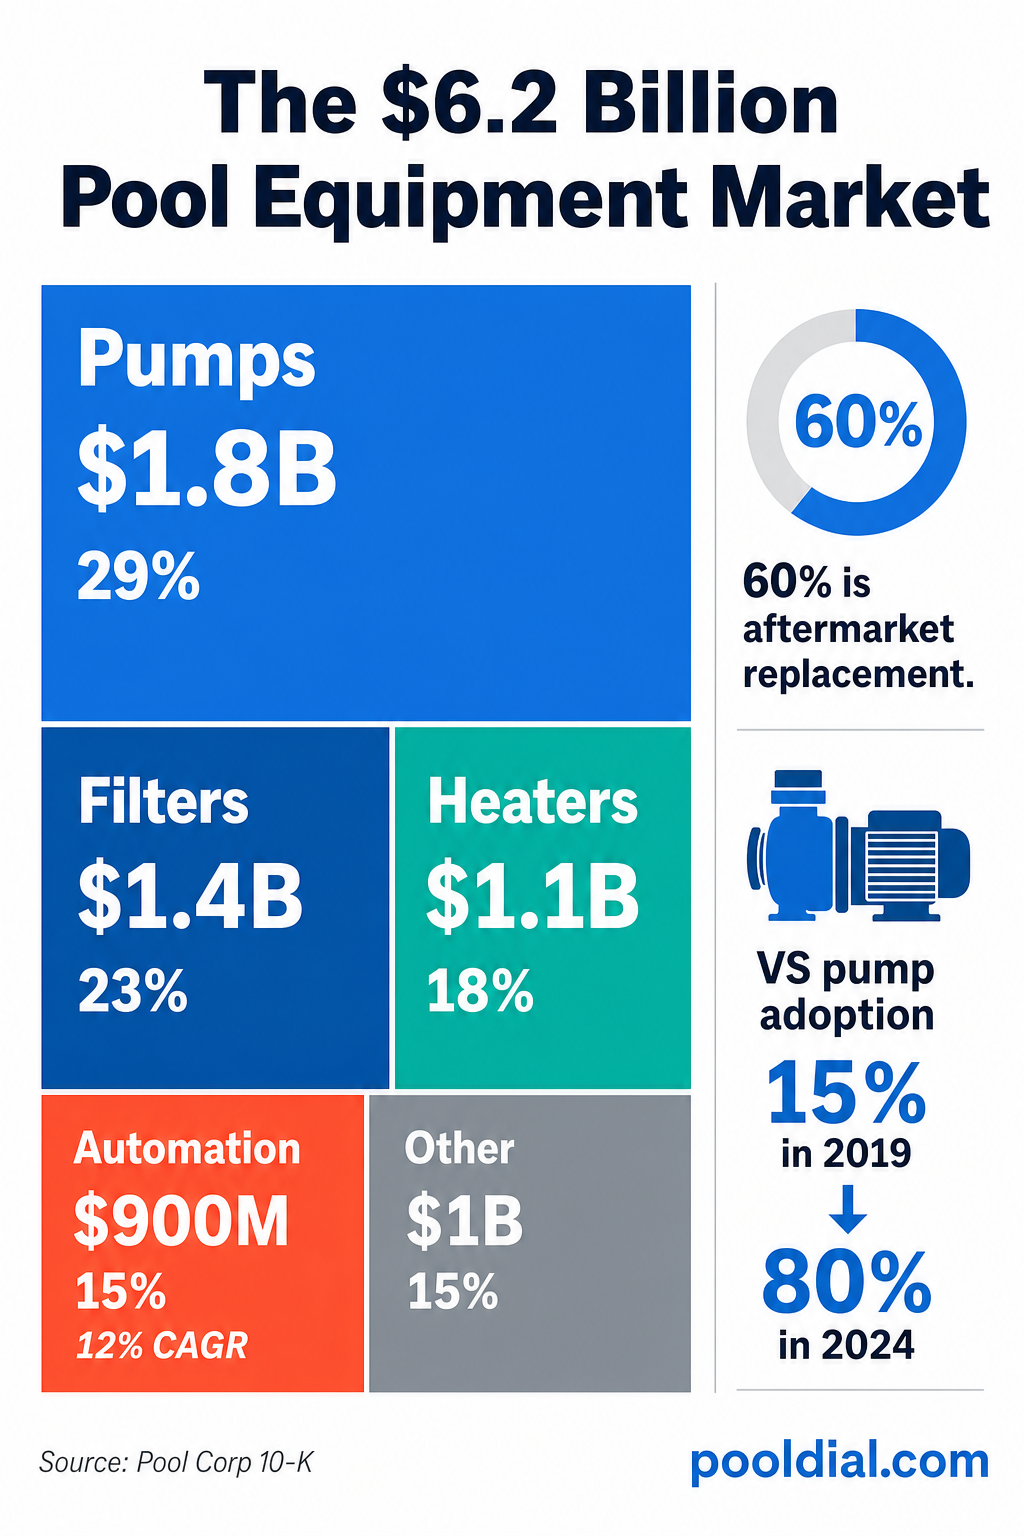
- $6.2 billion U.S. pool equipment market (2024)[1]Pentair PLC 10-KFiscal year ended December 31, 2024SEC Filing
- 80% of new pumps sold are variable speed (up from 15% in 2019)[2]Hayward Holdings 10-KFiscal year ended December 31, 2024SEC Filing
- 12% CAGR for pool automation systems through 2028[1]Pentair PLC 10-KFiscal year ended December 31, 2024SEC Filing
- 60% of equipment revenue comes from aftermarket replacement[3]Pool Corporation 10-KFiscal year ended December 31, 2024SEC Filing
- 7-10 years average equipment replacement cycle[2]Hayward Holdings 10-KFiscal year ended December 31, 2024SEC Filing
Equipment Market by Category
Pool equipment sales break down into several major categories. Each represents a significant business opportunity for pool service professionals who install and maintain this equipment.

The Variable Speed Pump Revolution
The pool pump market has undergone a dramatic transformation. In 2019, only 15% of pumps sold were variable speed. By 2024, that number reached 80%--driven primarily by DOE energy efficiency regulations that took effect in July 2021.[2]Hayward Holdings 10-KFiscal year ended December 31, 2024SEC Filing
This represents a 5.3× increase in VS pump adoption in just five years. The average VS pump now sells for $800+, compared to $200-300 for legacy single-speed models.[3]Pool Corporation 10-KFiscal year ended December 31, 2024SEC Filing

DOE Regulation Impact
The Department of Energy's pool pump efficiency standards (effective July 19, 2021) effectively banned the manufacture of most single-speed pumps over 1 HP. This regulatory shift created a massive upgrade cycle and increased the average pump sale price by over 3x. For more details, see our complete DOE pump regulations guide.
Energy Savings Drive Adoption
Variable speed pumps deliver significant energy savings that justify their higher upfront cost:
| Pump Type | Average kWh/Year | Annual Cost* | 10-Year Cost |
|---|---|---|---|
| Single Speed (1.5 HP) | 3,000 - 4,500 | $450 - $675 | $4,500 - $6,750 |
| Two Speed | 1,800 - 2,400 | $270 - $360 | $2,700 - $3,600 |
| Variable Speed | 500 - 1,500 | $75 - $225 | $750 - $2,250 |
*Assumes $0.15/kWh national average. Calculate your specific savings with our pump energy cost calculator.
Pool Automation Growth
Pool automation systems represent the fastest-growing equipment category, expanding at 12% annually through 2028.[1]Pentair PLC 10-KFiscal year ended December 31, 2024SEC Filing This growth is driven by:
- Smart home integration - Pool controls connecting to Alexa, Google Home, Apple HomeKit
- Remote monitoring - Homeowners want to check pool status from their phones
- Energy optimization - Automated systems can schedule equipment for off-peak rates
- Service professional tools - Remote diagnostics reduce service calls
The three major automation platforms are Pentair IntelliCenter, Hayward OmniLogic, and Fluidra's iAquaLink. Each has a connected app ecosystem and professional installer network.
Major Equipment Manufacturers
The pool equipment market is dominated by three major manufacturers, all publicly traded with detailed financial disclosures:
| Company | Pool Revenue (2024) | Key Brands | Market Focus |
|---|---|---|---|
| Pentair | $2.1B | Pentair, IntelliFlo, IntelliCenter | Pumps, automation, filtration |
| Hayward | $1.0B | Hayward, OmniLogic, TriStar | Full equipment line |
| Fluidra | $900M (U.S.) | Jandy, Zodiac, Polaris | Cleaners, heaters, automation |
Source: Pentair 10-K, Hayward 10-K, Fluidra Annual Report
Aftermarket vs. New Construction
A critical insight for pool service businesses: 60% of equipment revenue comes from aftermarket replacement and upgrades, not new pool construction.[3]Pool Corporation 10-KFiscal year ended December 31, 2024SEC Filing
This means the equipment market is relatively insulated from new construction downturns. With 5.4 million in-ground pools in the U.S. and equipment lasting 7-10 years on average, there's a continuous replacement demand of roughly 540,000-770,000 pumps, filters, and heaters per year.[2]Hayward Holdings 10-KFiscal year ended December 31, 2024SEC Filing
The breakdown: 60% comes from aftermarket replacement, 25% from remodel and upgrade projects, and only 15% from new pool construction. This means 85% of all equipment revenue comes from existing pools.[3]Pool Corporation 10-KFiscal year ended December 31, 2024SEC Filing

Heat Pump Market Growth
Electric heat pumps are gaining market share against traditional gas heaters, driven by energy efficiency and electrification trends:[2]Hayward Holdings 10-KFiscal year ended December 31, 2024SEC Filing
- Heat pumps: 300-400% efficiency (COP 3-4), $3,000-5,000 installed
- Gas heaters: 80-95% efficiency, $2,500-4,000 installed, faster heating
- Solar: Essentially free operation, $3,000-7,000 installed, climate-dependent
Heat pump sales have grown approximately 8% annually while gas heater sales have remained flat, reflecting broader electrification trends in residential equipment.[2]Hayward Holdings 10-KFiscal year ended December 31, 2024SEC Filing
Calculate heating costs for your customers with our pool heater cost calculator.
Salt Chlorine Generator Market
Salt chlorine generators (salt cells) have become a significant equipment category, now installed on approximately 15% of in-ground pools (roughly 800,000 pools).[3]Pool Corporation 10-KFiscal year ended December 31, 2024SEC Filing
Salt systems create recurring revenue through:
- Cell replacement: Every 3-7 years, $400-800 per cell
- Salt additions: Annual top-offs after draining or splash-out
- Maintenance: Cell cleaning, calibration, water balance adjustments
Distribution Channel Market Share
Pool equipment reaches end consumers through three primary channels:[3]Pool Corporation 10-KFiscal year ended December 31, 2024SEC Filing
| Channel | Market Share | Key Players |
|---|---|---|
| Professional Distributors | 55% | Pool Corp (POOLCORP), SCP, Superior |
| Retail | 30% | Leslie's, Pinch A Penny, local stores |
| Direct/Online | 15% | Amazon, specialty e-commerce |
Pool Corporation alone controls approximately 40% of the professional distribution market, operating 456 sales centers across the U.S.[3]Pool Corporation 10-KFiscal year ended December 31, 2024SEC Filing
What This Means for Pool Service Businesses
The equipment market data reveals several strategic opportunities:
- Variable speed pump upgrades are a major revenue opportunity. With 80% of the installed base still on older pumps, there's a huge upgrade market. Use our energy calculator to show customers their savings.
- Automation upsells are growing. Homeowners increasingly expect smart pool control. Position yourself as an automation expert.
- Aftermarket dominates. Your existing customer base is your best source of equipment sales. Track equipment age and proactively suggest replacements.
- Heat pumps are the future. As gas becomes less favored, heat pump installation expertise becomes more valuable.
- Salt systems create recurring revenue. Cell replacements and maintenance add predictable income.
For more industry data, see our complete 2026 pool industry statistics or state-by-state pool counts.
Sources
- [1] Pentair PLC Annual Report (Form 10-K) -- Fiscal year ended December 31, 2024. SEC Filing
- [2] Hayward Holdings, Inc. Annual Report (Form 10-K) -- Fiscal year ended December 31, 2024. SEC Filing
- [3] Pool Corporation Annual Report (Form 10-K) -- Fiscal year ended December 31, 2024. SEC Filing
- [4] Fluidra S.A. Annual Report -- Fiscal year ended December 31, 2024. Investor Relations