
Pool Service Rates in Arizona 2026: Complete Pricing Guide

Arizona is one of the top pool markets in the United States with over 600,000 residential pools, concentrated primarily in the Phoenix metro area. The desert climate creates unique service challenges and opportunities for pool professionals.
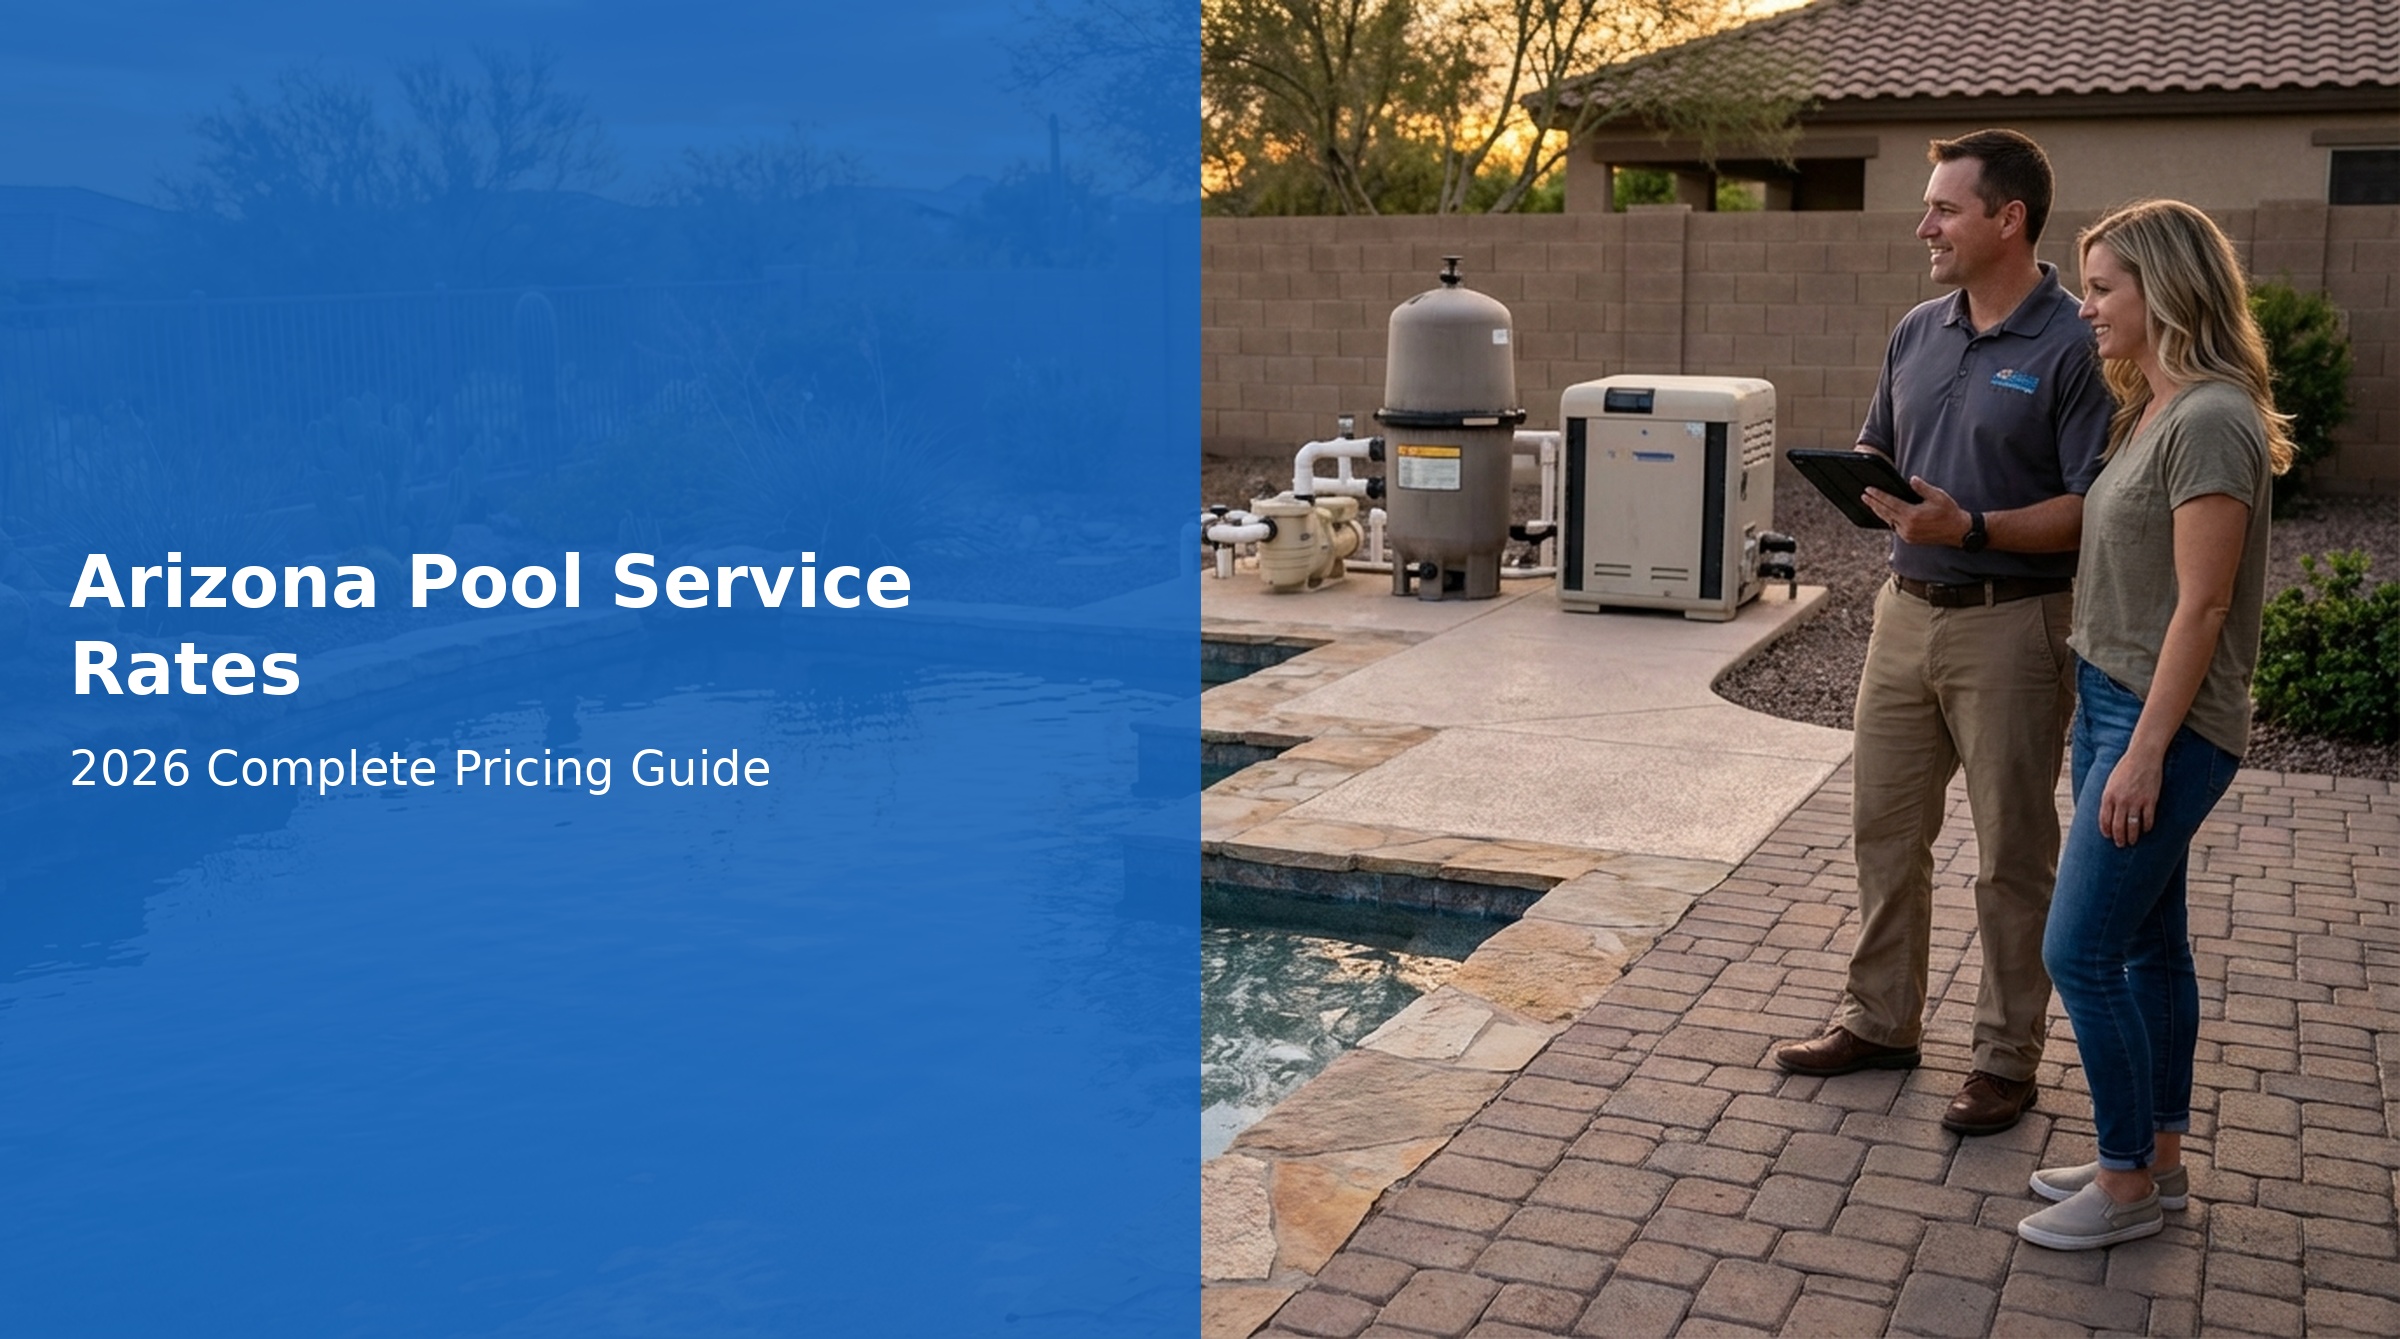
Here's what Arizona pool service professionals charge based on crowdsourced data from poolrates.fyi.
Monthly Average (Statewide)
$151.20
Median $150 · Range $125–$170
Monthly (With Chemicals)
$152.43
Median $150 · Range $147–$170
Monthly (Without Chemicals)
$148.33
Median $160 · Range $125–$160
Phoenix Metro (With Chemicals)
$156.67
Median $150 · Range $150–$170
Key Arizona Market Insights
- Data: 10 submissions statewide as of May 2026 — avg $151.20/mo, median $150, range $125–$170
- Operator profile: Average 377 pools per operator, 10.5 years experience; 3 solo, 7 team operations
- Year-round service: Arizona pools operate 12 months with peak demand in summer
- Extreme heat challenges: 110°F+ temperatures affect chemical consumption and equipment
- Competitive market: Phoenix metro is highly competitive with many operators
- Dust and debris: Desert environment means constant debris management
Arizona Pricing Data by Model
| Pricing Model | Range | Average | Median | Submissions |
|---|---|---|---|---|
| With Chems Flat Monthly | $147–$170 | $152.43 | $150 | 7 |
| Without Chems Flat Monthly | $125–$160 | $148.33 | $160 | 3 |
| All Statewide (Combined) | $125–$170 | $151.20 | $150 | 10 |
Regional Variations Within Arizona
Phoenix Metro (Maricopa County)
- Pricing: Avg $152.50/mo, median $155, range $125–$170 (6 submissions)
- With chemicals: Avg $156.67, median $150, range $150–$170 (3 submissions)
- Without chemicals: Avg $148.33, median $160, range $125–$160 (3 submissions)
- Operator profile: Avg 169 pools per operator, 9 years experience; 3 solo, 3 team
- Market: Largest concentration of pools, many operators
- Competition: Very high — volume is key to success
- Special considerations: Traffic and route efficiency are critical
Phoenix (City)
- Pricing: Avg $149/mo, median $150, range $147–$150 (3 submissions, all with chemicals)
- Operator profile: Avg 386 pools per operator, 13 years experience; all team operations
- Notes: Higher pool counts and experience levels reflect established team operations
Tucson Area
- Pricing: Slightly less competitive, mid-range pricing
- Market: Smaller but growing pool base
- Competition: Moderate compared to Phoenix
- Special considerations: University and retirement community markets
Scottsdale and Paradise Valley
- Pricing: Premium pricing opportunities
- Market: Luxury homes, resort-style pools
- Competition: High but customers expect premium service
- Special considerations: Larger pools, complex water features
Arizona Summer Tip: Summer temperatures exceeding 110°F dramatically increase chlorine demand. Many Arizona operators adjust chemical pricing seasonally or build summer premiums into their annual pricing to account for the 3-4 month extreme heat period.
Arizona-Specific Considerations
- Dust storms (haboobs): Frequent summer dust storms require extra cleaning visits
- Extreme UV: Chemical burn-off is accelerated; higher CYA levels common
- Monsoon season: July-September brings heavy rains affecting water chemistry
- Salt cells: Heat accelerates salt cell wear — factor replacement into pricing
- Early morning routes: Many operators start before dawn to beat the heat
How Arizona Compares to Nearby States
| State | Monthly Avg (w/chems) | Notes |
|---|---|---|
| Arizona | $151–$152 | Year-round, competitive; median $150 |
| California | $126-$132 | Similar pricing, higher labor costs |
| Nevada | Regional data | Las Vegas similar to Phoenix |
| Colorado | $216-$224 | Seasonal market, higher rates |
Calculate Your Arizona Service Pricing
Set competitive rates based on your actual costs and market position.
Calculate Your PriceRelated Articles
- Complete Pool Service Pricing Guide 2026
- Per-Stop vs. Monthly Pricing
- California Pool Service Rates 2026
- How to Price Your Pool Service Business
Source: Crowdsourced data from poolrates.fyi. Last updated May 25, 2026.